Case Studies > Non-Profit > Special Olympics
Special Olympics’ 30% Donation Jump with RMG
RMG’s analysis of customer behavior led to 30% increases in Special Olympic Donations, breaking $1MM.
Highlights
30% ↑
30% increase in donations
50,000
Analyzed over 50,000 donor and event records
$1 Million
Broke $1MM donation record
New Timing
Improved campaign timing to maximize effort & donations
Summary
Region
- North America
industry
- Non-Profit
Company size
- Large
rmg solutions
- Modeling & Analysis
- Digital Marketing
- Marketing Strategy
about
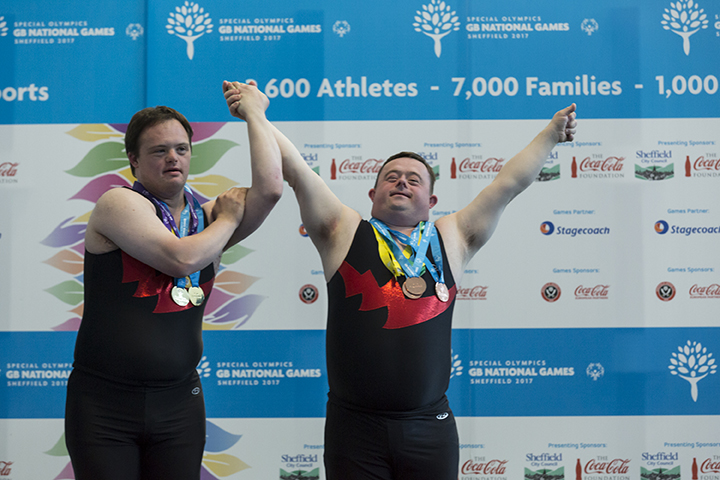
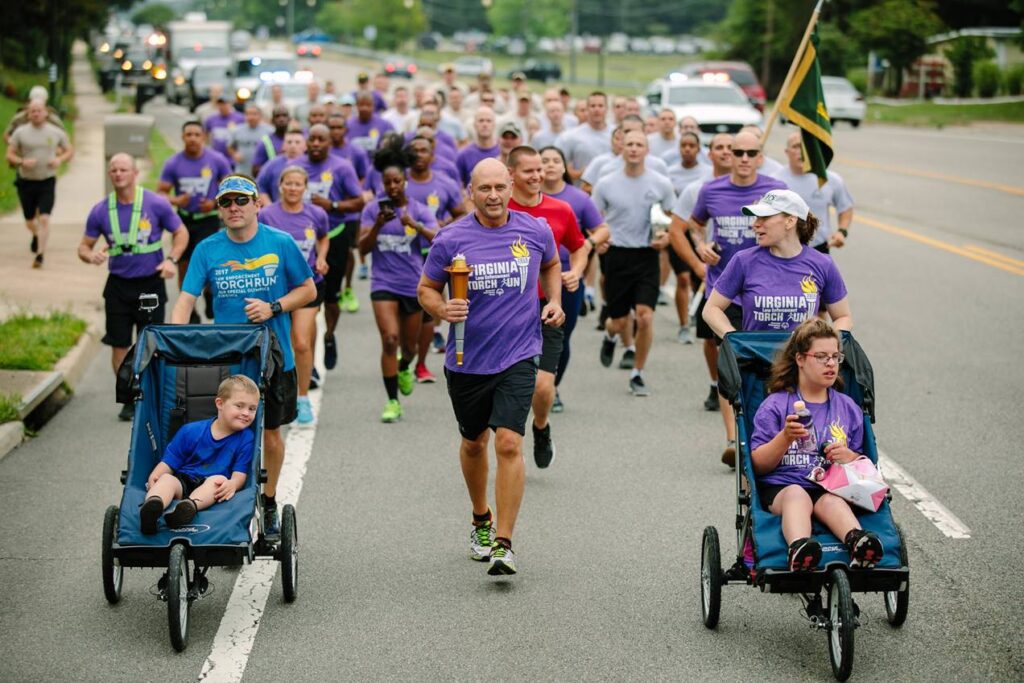
Special Olympics is the largest sports organization for people with intellectual disabilities. Through the organization, donations help fund everything for the athletes in need.
Challenge
Special Olympics wanted to understand the distribution of participant sign ups and donations up until an event by key event dimensions. Ultimately they wanted to forecast sign ups and donations so they could optimally change marketing activities to meet their desired event targets.
strategy
The analysis focused on a foundational exploratory analysis to understand sign up and donation patterns. Over 50,000 records were analyzed containing participant signups and donations. In addition the following fields were provided:
- Event
- State
- Gift amount
- Online vs offline donation
- Group vs Individual
- Repeat donor vs one-time donation
- The distribution of sign-ups and donations were examined by Days to Event.
solution
Our analysis determined that the average donation had increased each year and the average gift was higher if an individual belongs to a team, donates offline and is a repeat donor. Participant sign up and donation contributions are very predictable by week so we were able to provide an excellent opportunity for forecasting total event dollars. We also found that online donations represent 69% of total donation dollars and occur at a faster pace presumably due to the ease of making an online donation.
We helped the client understand It made sense to market to past participants and donors using social and email marketing to increase engagement, to look at donations by city and focus marketing in those high donation areas to “pick the low hanging fruit”
results
The 50,000 analyzed records built into a model tracked the previous years donor data. After identifying donor behavior, it was found that 60% of contributions in the first 4 weeks of launch, 30% in the last 2 weeks before an event, and only 10% between those windows.
Special Olympics questioned whether to pull back on marketing efforts in the middle, and in 2023 they took RMG’s learning and put a majority of their advertisement spending towards the front of their campaigns. This resulted in the largest donation year ever with a 30% increase, breaking their 1MM mark for fundraising.
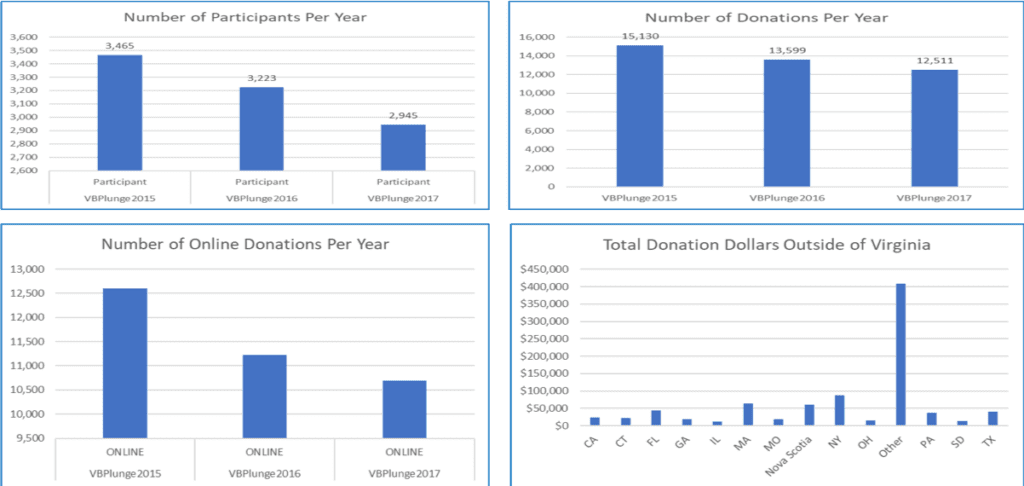
Event data was available for 50,873 individual leads including participants and donors
Number of participants and donations have dropped in the past 3 years
94% of participants and 73% of donations are from Virginia
Ready to Transform Your Marketing Performance?
Our experienced team is here to help you increase customer engagement, increase return on ad investment, enhance your marketing data, and get improved marketing performance.